
Last time we learned that by using covered calls you can limit loss, reduce your drawdown, and even profit on stocks you currently own during a bear market. Now, let's look at another option strategy that can be applied if no underlying security is currently owned. The simplest of strategies is simply to purchase a put.
A put gives you the right to sell a stock at a certain price prior to a set expiration date. For those unfamiliar with options, this can be confusing -- after all, why on earth would anybody sell you the right to sell them a stock at a certain price? If we step back and analyze the situation, however, isn't this exactly how your car insurance works? You pay a premium to your insurance company to have the right to sell your car back to them at a certain price. If you destroy your car and it is worthless on the open market, your insurance company will write you a check for the original value of your car.
Brining this concept back to the market, if you had your entire retirement savings in the stock market I bet you would be interested in learning that you can buy "insurance" that would protect the value of your portfolio -- however, that's the topic of another blog. What is important to understand now is that those "insurance policies," or puts, have value and can be traded as options on the market. As the price of a stock drops, the value of your put raises inversely!
Wednesday, October 22, 2008
Friday, October 10, 2008
How to Profit in A Bear Market - part 1
I have talked to a lot of people who have a sinking feeling in their stomach that matches the sinking markets we have watched over the last several weeks. 401K's are taking a big hit and Buy and Hold investors are watching all of their gains for the last few years disappear. Honestly, my heart hurts for them -- so let's talk about a few strategies to preserve capital or even profit from this bear market.
For starters... have you looked at a 20yr weekly chart of the S&P?

For starters... have you looked at a 20yr weekly chart of the S&P?

While the markets appear scary, it wasn't really that long ago that we encountered a similar experience -- and history often repeats itself in economics. Beginning in 2000 and then fueled by 9/11/01 we saw the S&P retrace from 1,500 to 800. So this market adjustment isn't completely out of the blue. It is also interesting to note that that parabolic decent has been more drastic during this bear market than what we experienced in 2000-02, which typically means a shorter trend. However, I don't want to minimize the retracement over the last 7 days -- I know it has been painful for many individuals. One thing we do know is it's unlikely the market will flip immediately bullish again as it will likely take several months to establish a strong support level after this speedy decent. Therefore, we need to be prepared to implement strategies that will enable us to continue being profitable in a sideways or bearish market.
One simple strategy that would work well for our Buy and Hold friends would be to execute the sale of some covered calls. For every 100 shares that you own of an underlying security you are able to sell 1 option contract. Therefore, if you don't expect your stock to rise in the next month, and you don't really intend to sell it -- you may as well sell somebody the option to purchase your stock at a premium price (after all, you don't really expect the stock to hit that price!)
EXAMPLE:
If you don't expect GM to increase much over the next month, you might be interested in selling a $7 call option for a profit of $105 -- all of which is yours unless the option is exercised.
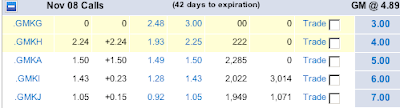
The only potential "loss" in this scenario would be unrealized gains -- that is, if GM jumped to $8, you would be forced to sell your shares for $7. The reality is, you should be ecstatic to sell GM for $7 in the next month! If that did happen, you could then turn right around and buy the stock again if you'd like.
I have heard of people applying this strategy so consistently that they paid off the entire initial purchase price of their underlying security and were simply collecting "rent" on the stock each month. In fact, if you bought 100 shares of GM right now for $4.89 you would have it "paid off" in 5 cycles -- or roughly 5 months! Or perhaps look at the numbers this way: for roughly a $1,000 investment you could generate about $200 a month cash flow!
Wednesday, October 1, 2008
Strangle the Bailout Vote

Bloomberg just announced the Senate will vote tonight on the Bailout. If you are interested in an article that expresses why I personally think the proposal is a bad idea -- read this. Regardless, with the imminent volatility ahead, today would be a good day to set up a Strangle (no pun intended!) Here is how the setup will work.
I'm going to choose CME because its price will be directly effected by tonight's vote, and it also made a large, $70 move on monday during the first vote -- let's expect history to repeat itself.
The strangle is simple -- let's not overcomplicate it. Basically you are placing 2 simultaneous trades, one for either direction of market movement. A slightly out of the money Call and Put are purchased with the same expiration date and underlying asset. CME is currently trading at $390 as I write this, so I will be purchasing the $400 Call and the $380 Put. When I wake up tomorrow and find out which way the market is headed, I'll close the "wrong" position for whatever is left of it, and go to the bank on the profitable one.
DANGER: The significant problem here is that the Market Makers know that huge volatility is ahead and they are inflating the options right now. You can see this inflation in several areas: the size of the spread is $2 or more right now, Implied Volatility is well over 70, and the Delta for these OTM options is below 50. The question is, will the move be significant enough to still be profitable -- this is why they make virtual accounts, to test our skills!
Tuesday, September 30, 2008
Time to Bail Out before the Bail-Out?
If you listen to CNBC, Henry Paulson, President Bush, even your local radio station you might be tempted to throw your hands in the air for in their terms clearly "the economy is collapsing." Personally, I call their bluff because I truly believe capitalism is superior to socialism and although the road may be bumpy and difficult for a little while, our economy will correct. There is our fundamental difference, I see the economy correcting itself, they see it collapsing. Another word they fail to recognize is "consequence." Indeed there are consequences to certain economic behavior -- we are a country that is accustomed to spending more than we can afford, and our government sets the standard with our nearly 10 Trillion Dollar debt. Unfortunately, the consequences of those decisions are now on our doorstep. I could go on for quite some time but I would rather discuss how this needs to affect our trading strategies for this week
I actually closed the majority of my bearish positions Monday as most of my picks rushed toward solid support ground -- I'm sure Jeremy will be discussing this so I don't want to steal his thunder. Normally I would wait for confirmation of support and begin looking Bullish again. Unfortunately, the market is relatively unpredictable right now -- largely waiting for a re-vote on the Bail Out on Thursday or Friday. So personally, to keep myself from getting bored and to stay diligent with my homework, I have elected to focus on very short term, even day trades through this week. With the amount of attention and volatility the market has right now this is a perfect time to apply your technical analysis to intraday charts at 5 min. intervals. However, be prepared in your strategy for news driven volatility when congress revotes on the Bail Out toward the end of the week.
I actually closed the majority of my bearish positions Monday as most of my picks rushed toward solid support ground -- I'm sure Jeremy will be discussing this so I don't want to steal his thunder. Normally I would wait for confirmation of support and begin looking Bullish again. Unfortunately, the market is relatively unpredictable right now -- largely waiting for a re-vote on the Bail Out on Thursday or Friday. So personally, to keep myself from getting bored and to stay diligent with my homework, I have elected to focus on very short term, even day trades through this week. With the amount of attention and volatility the market has right now this is a perfect time to apply your technical analysis to intraday charts at 5 min. intervals. However, be prepared in your strategy for news driven volatility when congress revotes on the Bail Out toward the end of the week.
Thursday, September 25, 2008
Oh what will Friday bring?
Well we've been watching the market for a whole week now and unfortunately we don't have much to report. 
Despite huge market moves we are moving remarkably sideways. To be more specific we're trading into a relatively large triangle pattern. Give it a few more days and it has to break one way or the other - or of course if we believe Henry Paulson we would read this triangle to say that we are trading sideways until all trading dries up completely and the sky falls....
Seriously nothing's going to dry up completely. By my best guestimates we can't trade forward in this triangle more than another 6-7 days. So at least by this time next week we should see a break one way or another. In the mean time, don't be surprised if we just get to keep going up, and down, and up, and down.
Also it's worth noting, despite huge moves in the market the last few days, and mighty manipulation by the government, the volume all week has been relatively low. With that said look to trade the market in the direction of a breakout of the triangle when there's enough volume to push through the moves. Until then - Consider day trading and hold on tight :)
Happy Trading tomorrow.
Sunday, September 21, 2008
Week in Preview (9-22-08)
After an insanely crazy week this past week investors are anxious to see what the market decides to do this coming week. Fears which were accented by the fed at the first of the week were actually calmed by the fed toward the end of the week. However after a few days to sit on it and think about it tomorrow could truly bring anything. In my last post I shared my prediction of the S&P heading down to 1100. I still think that could happen. Unfortunately the Fed is trying hard to manipulate the market which makes things much more difficult to predict. However there are still some thing apart from the fed which indicate the market to be in an overall bear trend. While I do think the bottom is near, and could be here after the fed's actions at the end of the week, we must approach this market very cautiously. We must always remember 2 things:


1) Trade the market based on the technicals
2) Be prepared for anything and trade appropriately.
Let's look at the S&P and I'll show why I'm still mostly bearish on the market.
In my last post I highlighted this classic falling 3 pattern. Even though we bounced off of a previous support on thursday I mentioned I felt the next level of support is much stronger. Of course the fed's announcement this past Friday really turned things around so theoretically we could have just bounced. However, notice Friday's close was just about the same as Monday's Open. Leaving the week with huge moves, but a virtually unchanged week. A look on the weekly chart shows we are still solidly in a down trend.
To accent my feeling of general bearishness check out the moving averages.
Friday's move traded up to but not through the 50 day moving average. This is a common retracement for the S&P. In fact if you look at the last year the S&P tends to acknowledge the 50 day moving average as a pretty good measurement of bearishness vs. bullishness.
The next reason is a glance at the ADX indicator on S&P.
Typically when a new trend is beginning you will see ADX moving up, as we did in the move from the last two weeks. ADX measures the strength of the trend. On Friday ADX moves down. While it is an indication that the bearish trend may be slowing, it is not an indication that a bullish trend has begun.
All this is not meant to be bad news, simply cautionary. The market can be brutal to those who don't know what's going on, but if you can see these trends and read the market a bit you will be in a position to take full advantage of these great moves. Happy trading this week and be sure to check out some free classes at The Financial Puzzle.
Thursday, September 18, 2008
Oh where is the bottom?
So the big question everyone's asking after this week of major shake up is "when will the pain stop". Obviously the market is never 100% predictable but I'm going to go ahead and hit the record saying I foresee the S&P falling to 1100 before the election. Here's why:


Today the S&P traded down to & bounced on a
previous support
from 2005. But there's a much stronger support from 2004 that sits right at the $1100 mark. Although anything can happen the older 2004 support will more likely be the ultimate basing ground.
To point out more reason why a short term bear market is not over, one must consider the appearance of a strong falling three candle pattern as seen in Yellow here:
This classic candle pattern is very consistent in foreshadowing a coming bear market. Don't be surprised if the S&P trades down to and around 1100 for a while before turning bullish, and don't be surprised if this market continues up to the election.
Subscribe to:
Posts (Atom)


