
 While we do have the major support dip down to around 7500 back in Nov, I would expect this support to hold just north of 8000. Of course we'll see. A dip down to the 8k range and then a turn upward should provide some good momentum to make some bullish trades in the market. In the meantime be extra careful with bull trades and try to grab a few bearish profits while you can.
 Tuesday, January 13, 2009
A Couple Bearish Days Leading to Support
If you read my post on Friday you know I'm mostly bullish for the short term on the DOW, however it looks like we'll have a couple more bearish days before we make it back down to support. With so many stocks settling into some consolidation channels it makes a lot of sense the DOW would as well.
While we do have the major support dip down to around 7500 back in Nov, I would expect this support to hold just north of 8000. Of course we'll see. A dip down to the 8k range and then a turn upward should provide some good momentum to make some bullish trades in the market. In the meantime be extra careful with bull trades and try to grab a few bearish profits while you can.
While we do have the major support dip down to around 7500 back in Nov, I would expect this support to hold just north of 8000. Of course we'll see. A dip down to the 8k range and then a turn upward should provide some good momentum to make some bullish trades in the market. In the meantime be extra careful with bull trades and try to grab a few bearish profits while you can. Saturday, January 10, 2009
Market Analysis
Oh where is the bottom and how do I trade? This is the question on almost everyone's mind. Hopefully I can offer some insight here.
I'll start off with the bad news. The bad news is there's not too many people crying bull. From CNBC To Fox Business, to Money Magazine, to just about every other news outlet you can find - The market looks doomed. The current issue of Traders World magazine doesn't help much. Eric Hadik of INSIIDE track is calling for 1-3 years of bearish behavior. And in the same issue Robert Giordano is calling for DOW support at 7150. Could they be right? Yep - they could be. They could also be wrong.
Take a look at this chart:

Okay, I know at first glance it looks like Chinese... or something. But there really is logic here. From a pure theoretical standpoint the bears could be right. There's the whole 17 year theory, the 34 year theory (which go together by the way) the presidential year theory, the "I made up a theory" theory - and not to mention the extreme negative bias by the media which tends to manifest in bearish behavior and sentiment.
However, from a pure charting standpoint there's hardly any reason to be bearish - in fact there's almost completely nothing but bullish signals. Let's look at a few of them.
First of all let's talk about the support line: My personal lines for support sit between 7500 and 7750. Giordano could be right with his 7100 range but I think that's pretty forgiving, certainly when paired with what I'm about to show you.
1) line construction - Giordano must be drawing his lines off of candle wicks. It's fine, but sometimes not consistent. I'm drawing mine off of a line chart.
2) Iterations - There's really only once way back in 2002 where support was found in the 7100 range, however there are 3 times on the line chart where my support held. And when we add candles for confirmation there's a total of 7 iterations dating back to '97! (This is using a weekly chart)
3) With a daily chart we see massive support in Oct. '97, Oct. '98, Jul & sept 2002, March 2003, and assuming it holds now oct/nov '08.
4) Patterns: There are currently no trends in place. We see a sideways channel. A channel can last for 3-4 months, or I've seen them last a year or more. A few years ago SHLD channeled sideways for right around a year. All it means in the broad picture is things are going nowhere. Already this channel has lasted 3 1/2 months. Who knows when it will break.
5) Candle Pattern: On Friday Oct. 10 we saw a massive dark candle at lunch time. At one point the market was trading around a 2400 point loss for the week. But by the end of the day we regained some value and closed the day with a high wave spinning top candle (or close enough). THAT is how bottoms are formed. I told my wife on that day "this is a good sign". Then just a few days later on the 27th & 28th we saw a massive bullish engulfing signal. Good sign #2. As is common during a basing period we saw one more major test of the bottom on Nov 20 & 21 (highlighted in yellow on my chart). The 20th threw a long dark candle, and the 21st completed the tweezer reversal pattern by showing the exact opposite on the next day. When this candle pattern occurs at the bottom of a trend it is most often a bullish reversal signal.
I will make note back in Sept I pointed out the falling 3 wedge pattern and said in the next few days expect the market to break to the downside. I was right then, and once again this candle pattern will likely provide at least some bullish move.
The sideways move we've seen in the past 3 months is completely normal and symptomatic of a market forming a bottom. Take heart if you're worried. It's very true that the other bearish indicators may prove to push the market lower, but I personally find the chart patterns to be quite accurate.
The trick about technical analysis is to balance all the different indicators. The bear guys were right - but now I think the chart is taking over and the bulls are about to run. Of course, it can all change tomorrow!
During these sideways markets my personal favorite strategies for trading are to sell options and trade as neutral as possible. Every day can be a new adventure. A lot of stocks are set up perfectly for complex option strategies. You should be able to find plenty of stocks to write Iron Condors on. And of course if you're down a bit and want to just make some income start writing some covered calls. You can recoup a good portion of your losses a lot quicker than you think!
Will RIMM follow Apple?
Hey, it's J-Dub here (that's my nick name for those of you who don't know). So we finally got everything up and running and now I can get back to blogging and throwing out some good analysis.
It's no secret I'm an apple fan. Love their computers, love their music players, love their phones - oh yea, love their stock. It's always fun to trade. However a lot of people seem to miss the fact that their evil phone counterpart Research in Motion (RIMM) is just as much fun to trade. In fact based on volume about half as many people trade RIMM as AAPL. But the funny thing we have noticed over the last year is how close the two run together.
This started appearing about a year ago, and while it's taken that long for the patterns to adjust and fully look like a mirror, over the last 6 months it's been easy to confuse the two charts. In fact one time in an online class back in October we were talking about AAPL but somehow the RIMM chart showed up. I got so confused and I remember saying "When did apple drop to $50/share?"
None the less - over the next little bit I'm going to continue this comparison as often a trade on one is actually setting up a trade on the other. If you need an easier trade then that then I think we need to talk!
Currently both stocks are forming what appears to be a pretty strong base/foundation. I'm mostly bullish on both. But I'll give better analysis in a post to come.
Friday, January 9, 2009
AAPL: Wedge vs. Divergence
AAPL is trading right into a falling wedge with the 50 EMA acting as strong resistance while simultaneously showing bullish divergence against MACD. Typically, each of these individual signals indicate different moves: the falling wedge is bearish and the bullish divergence is... well, bullish. However the failed break back in late November is certainly giving this a more bullish feel. Additionally, we are at a very strong, 2 year support level around that $84-$85 range.
This is a great time to set up a bracketed entrance as our anticipated downside target is $71 (with a pause at $80) and conversely the upside potential is roughly $110. This is also a great example of the moving averages forming the wedge for us as we see the price caught between the 20 EMA and the 50 EMA. Look for AAPL to trade sideways for a few more days with an entrance into a trade as the price breaks through either one of these averages. Remember to confirm the break based on volume and a tested pull back and I'd have obvious caution in the event of a downside move at the $85.27 support.
Below is a chart of the analysis. I've also posted a larger version here:
As always, Happy Trading!

Wednesday, October 22, 2008
How to Profit in A Bear Market - part 2
Last time we learned that by using covered calls you can limit loss, reduce your drawdown, and even profit on stocks you currently own during a bear market. Now, let's look at another option strategy that can be applied if no underlying security is currently owned. The simplest of strategies is simply to purchase a put.
A put gives you the right to sell a stock at a certain price prior to a set expiration date. For those unfamiliar with options, this can be confusing -- after all, why on earth would anybody sell you the right to sell them a stock at a certain price? If we step back and analyze the situation, however, isn't this exactly how your car insurance works? You pay a premium to your insurance company to have the right to sell your car back to them at a certain price. If you destroy your car and it is worthless on the open market, your insurance company will write you a check for the original value of your car.
Brining this concept back to the market, if you had your entire retirement savings in the stock market I bet you would be interested in learning that you can buy "insurance" that would protect the value of your portfolio -- however, that's the topic of another blog. What is important to understand now is that those "insurance policies," or puts, have value and can be traded as options on the market. As the price of a stock drops, the value of your put raises inversely!
Friday, October 10, 2008
How to Profit in A Bear Market - part 1
I have talked to a lot of people who have a sinking feeling in their stomach that matches the sinking markets we have watched over the last several weeks. 401K's are taking a big hit and Buy and Hold investors are watching all of their gains for the last few years disappear. Honestly, my heart hurts for them -- so let's talk about a few strategies to preserve capital or even profit from this bear market.
For starters... have you looked at a 20yr weekly chart of the S&P?

For starters... have you looked at a 20yr weekly chart of the S&P?

While the markets appear scary, it wasn't really that long ago that we encountered a similar experience -- and history often repeats itself in economics. Beginning in 2000 and then fueled by 9/11/01 we saw the S&P retrace from 1,500 to 800. So this market adjustment isn't completely out of the blue. It is also interesting to note that that parabolic decent has been more drastic during this bear market than what we experienced in 2000-02, which typically means a shorter trend. However, I don't want to minimize the retracement over the last 7 days -- I know it has been painful for many individuals. One thing we do know is it's unlikely the market will flip immediately bullish again as it will likely take several months to establish a strong support level after this speedy decent. Therefore, we need to be prepared to implement strategies that will enable us to continue being profitable in a sideways or bearish market.
One simple strategy that would work well for our Buy and Hold friends would be to execute the sale of some covered calls. For every 100 shares that you own of an underlying security you are able to sell 1 option contract. Therefore, if you don't expect your stock to rise in the next month, and you don't really intend to sell it -- you may as well sell somebody the option to purchase your stock at a premium price (after all, you don't really expect the stock to hit that price!)
EXAMPLE:
If you don't expect GM to increase much over the next month, you might be interested in selling a $7 call option for a profit of $105 -- all of which is yours unless the option is exercised.
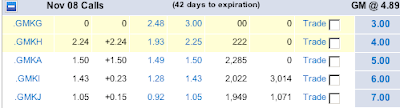
The only potential "loss" in this scenario would be unrealized gains -- that is, if GM jumped to $8, you would be forced to sell your shares for $7. The reality is, you should be ecstatic to sell GM for $7 in the next month! If that did happen, you could then turn right around and buy the stock again if you'd like.
I have heard of people applying this strategy so consistently that they paid off the entire initial purchase price of their underlying security and were simply collecting "rent" on the stock each month. In fact, if you bought 100 shares of GM right now for $4.89 you would have it "paid off" in 5 cycles -- or roughly 5 months! Or perhaps look at the numbers this way: for roughly a $1,000 investment you could generate about $200 a month cash flow!
Wednesday, October 1, 2008
Strangle the Bailout Vote

Bloomberg just announced the Senate will vote tonight on the Bailout. If you are interested in an article that expresses why I personally think the proposal is a bad idea -- read this. Regardless, with the imminent volatility ahead, today would be a good day to set up a Strangle (no pun intended!) Here is how the setup will work.
I'm going to choose CME because its price will be directly effected by tonight's vote, and it also made a large, $70 move on monday during the first vote -- let's expect history to repeat itself.
The strangle is simple -- let's not overcomplicate it. Basically you are placing 2 simultaneous trades, one for either direction of market movement. A slightly out of the money Call and Put are purchased with the same expiration date and underlying asset. CME is currently trading at $390 as I write this, so I will be purchasing the $400 Call and the $380 Put. When I wake up tomorrow and find out which way the market is headed, I'll close the "wrong" position for whatever is left of it, and go to the bank on the profitable one.
DANGER: The significant problem here is that the Market Makers know that huge volatility is ahead and they are inflating the options right now. You can see this inflation in several areas: the size of the spread is $2 or more right now, Implied Volatility is well over 70, and the Delta for these OTM options is below 50. The question is, will the move be significant enough to still be profitable -- this is why they make virtual accounts, to test our skills!
Subscribe to:
Posts (Atom)


